Welcome to the official Wolfe Wave website as taught by Bill Wolfe. Please take a tour.
“Seeing” the Future(s). I can teach you how.
Update 11/15/25. This special offer of a $1000 discount for wealthy traders will be ending soon.
$1000 discount for wealthy traders. You read that right. It is in my and my Wolfe Wave Practioners interest to have wealthy individuals, or those from firms that trade “size” to help tip Wolfe Waves at critical reversal points. Join the gang! (Limited time offer.)
Update: 10/22/25. Potential very bearish wave forming.
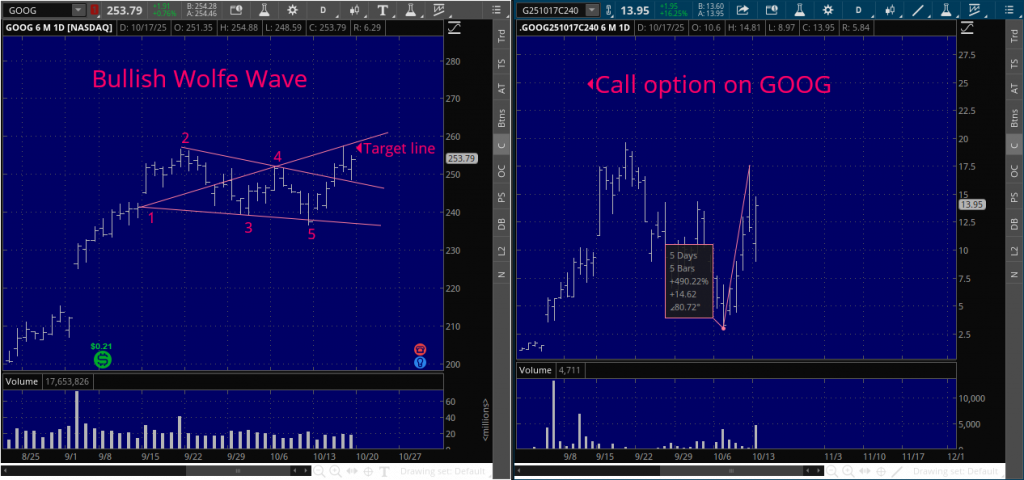
Update: 10/18/25.
I sincerely thank all my Wolfe Wave Practioners for piling in at the 5 point, the tipping point. GOOG call option up 490%.

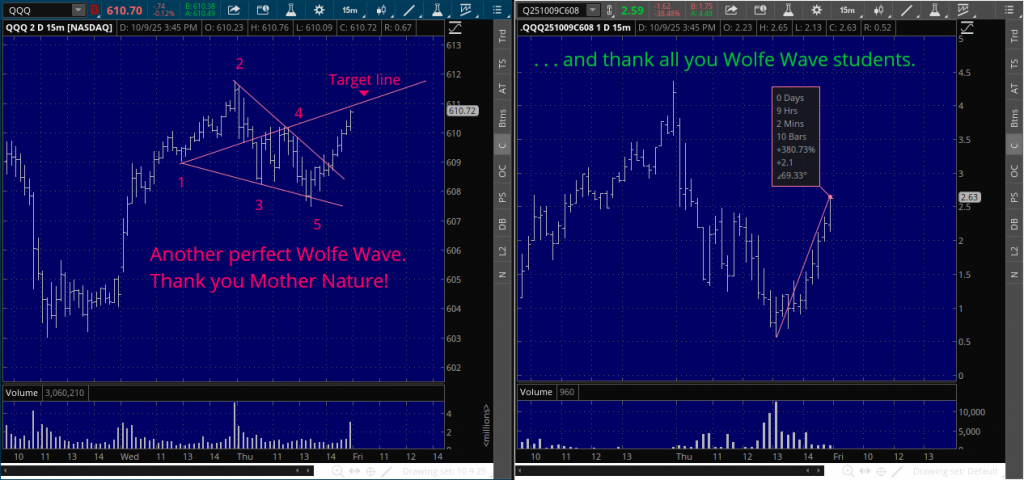
Update: 10/9/25.
Thank all you wealthy Wolfe Wave students for piling on the QQQ bullish Wolfe Wave at the tipping 5 point. If this keeps up I may have to increase my price.

UPDATE: 10/3/25.

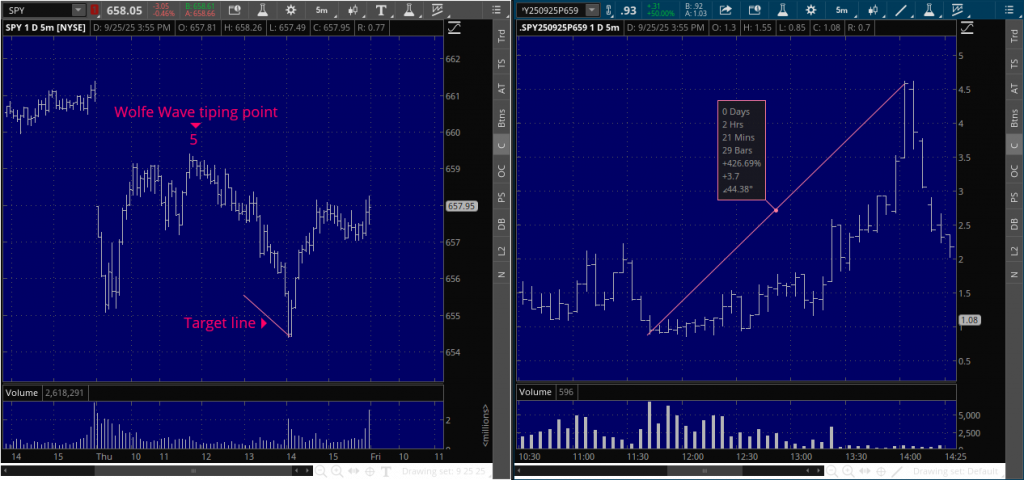
UPDATE: 9/25/25. Perfect ! Thank all you Wolfe Wave Practioners for piling on at the 5, Wolfe Wave tipping point. YOU make my methodology come to life. 426% gain in two-hours for the SPY put option.

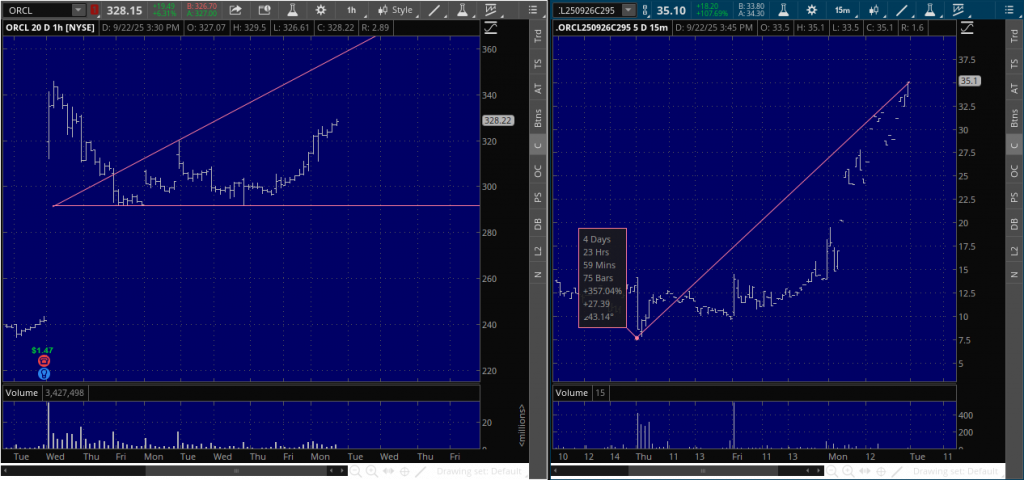
UPDATE: 9/22/25. Thank all you wealthy traders that trade “size” and heavy hitters that took advantage of my special offer, above, for buying stock and call options on ORCL when the price was at the 5 point. The Wolfe Wave critical tipping point.

UPDATE: 9/2/25. Thank all you wealthy traders that trade “size” and heavy hitters that took advantage of my special offer, above. The Wolfe Wave was at that critical tipping (5 Point) and you Guys/Gals came through by piling on to exacerbate the reversal that nailed the Target Line. The ES move down was worth more than 100 points.

The Wolfe Wave is a natural rhythm. It knows no allegiance to borders or politics. I don’t predict the market, I read the Waves.
Deep Space Hubble Telescope

So, what does this have to do with the stock market?
My ingredients are all natural. I use no preservatives or harmful additives like: Indicators, oscillators, moving averages, or other junk.
I do use tools that were given to us by the Creator: Fibonacci spirals, waves, pendulum, vibrations and more.
-
An Illustration Along with the Rules
Please note the odd sequence in counting, as you will see, it is necessary for the inductive analysis. By starting with a top we are assured of beginning our count on a new wave. (The reverse would apply for a bearish wave.) The 2 point is a top. The 3 point is the bottom of…
-
NEWS FLASH!!! The Wall Street Journal Corroborates Wolfe Wave methodology
WSJ Corroborates W.W. Methodology
-
Click Here if You Think the Government is Out to Get You
“Day trader goes berserk and kills television” “Survey shows that 99% of day traders lose money” “Scientist discovers possible link between day trading and acne” Ever wonder why day trading gets such bad press? Day trading is often compared to horse racing and casino gambling, yet horse racing and casino gambling don’t come under assault. …
-
A Wolfe Wave on a 1-minute S&P Chart
For those of you who consider a 5 minute chart “long-term,” the above 1 minute chart catches a “Picasso” in Wolfe Wave analysis. A perfect ETA and EPA. However in actual trading I advise against using the ETA as it just adds too many variables. Use the EPA to purchase a genuine Picasso.
-
Trading OEX Options off a 15-minute S&P Chart
As some traders already know, trading options is somewhat like that old game of “beat the clock.” In order to reap the huge reward, you not only have to be right on price direction, but you also must be correct on timing. The WolfeWave is the perfect tool for this. On the above S&P chart,…
-
A Wolfe Wave on a Daily Stock Chart
Pavlov got his dogs to salivate at the sound of a bell. So do WolfeWave practitioners. Opening Bell. Stock and option traders, could have had a beautiful measured move on the above daily chart of IBM. Without learning the “X-Ray Vision” so to speak–it took me almost 35 years–it would be almost impossible to find…
-
A Wolfe Wave on a Weekly Stock Chart
The “surprise” explosion in the price of gold did not come as a surprise to WolfeWave practitioners. As savvy investors know, the share prices of gold stocks often rise before the price of the metal. The above weekly chart of ASA has a beautiful WolfeWave that telegraphed the move weeks in advance when it hit…
-
Are You Afraid of the Dark?
Most traders are afraid to hold overnight. WolfeWave practitioners make money while they sleep. On the above chart, the “sweet zone” (5) was entered shortly before the close indicating a move up to the target line. Next day, at the opening, TV was telling traders that it was going to be a “great day” because…